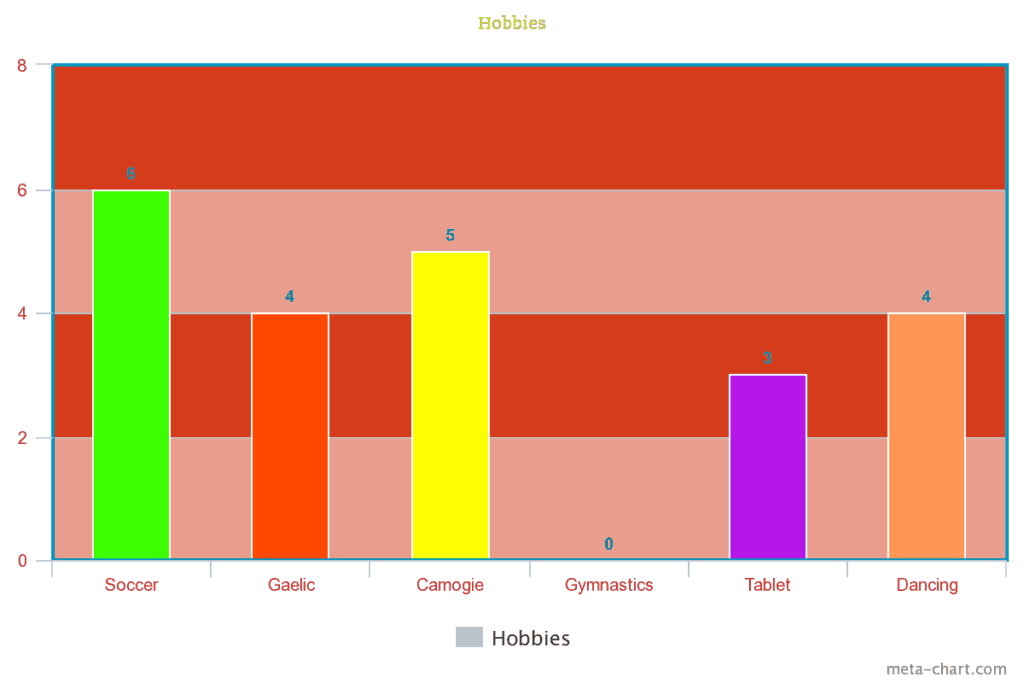
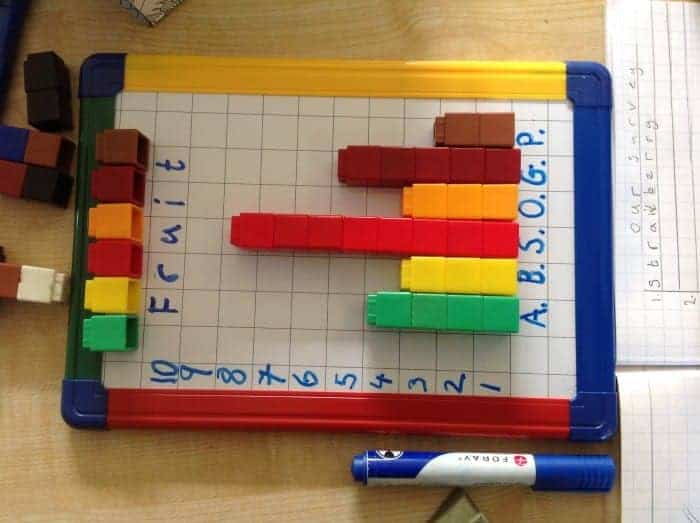
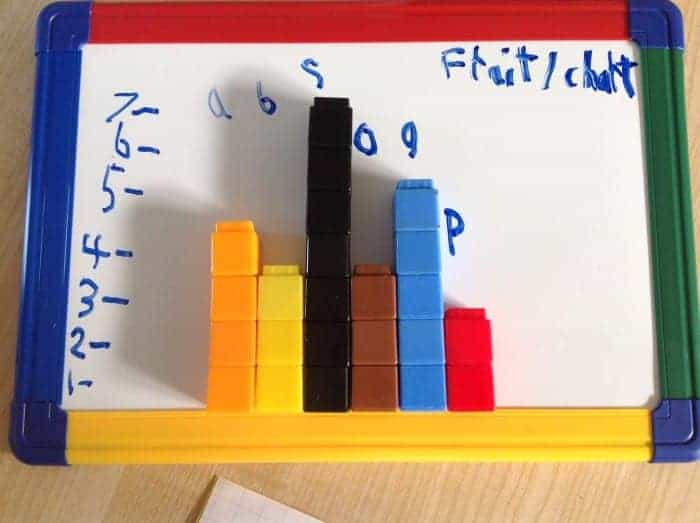
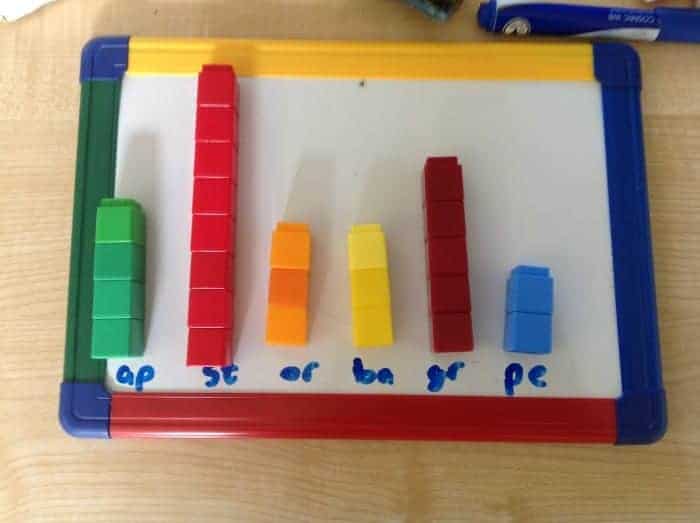
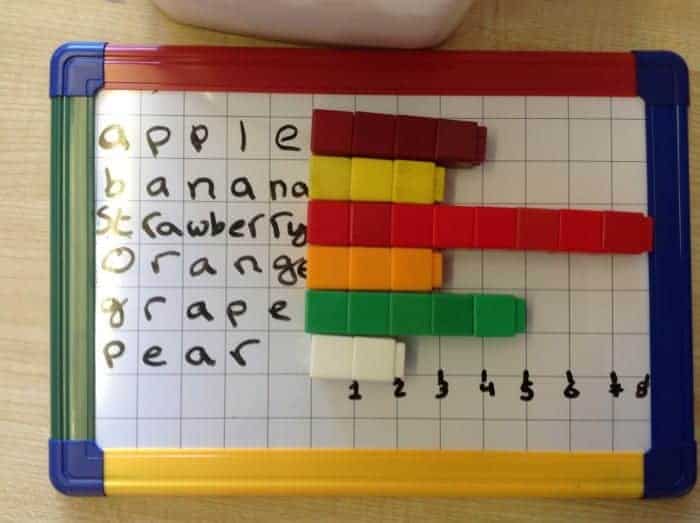
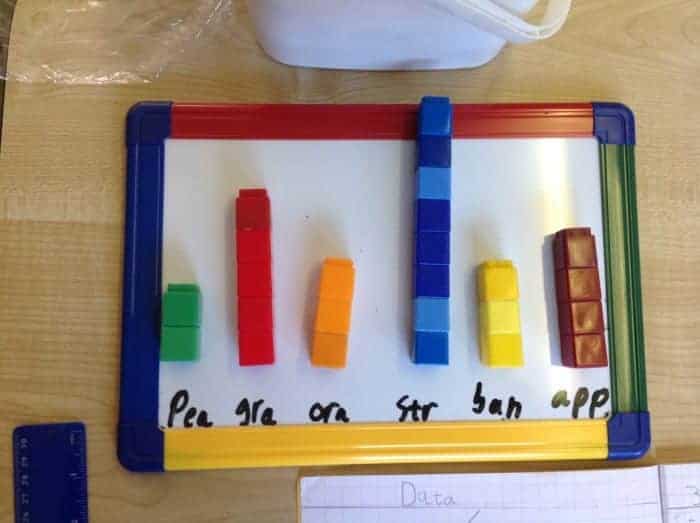
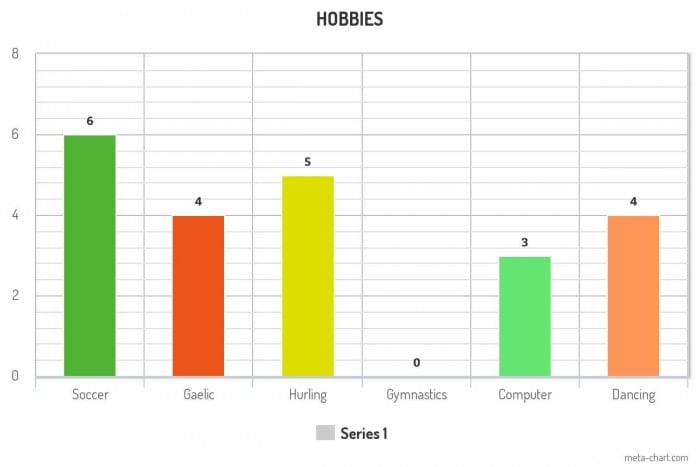
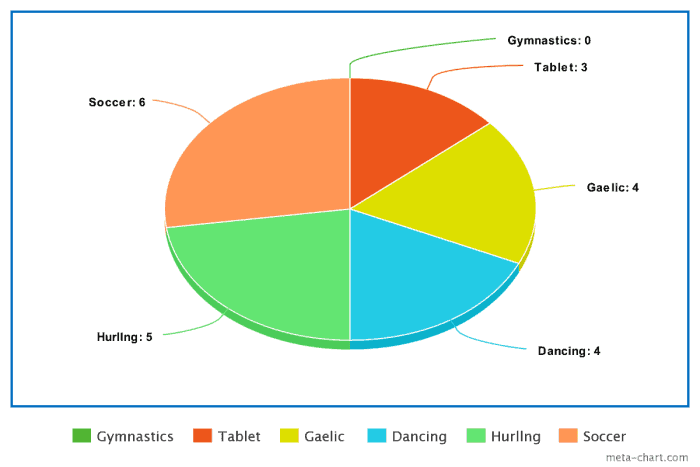
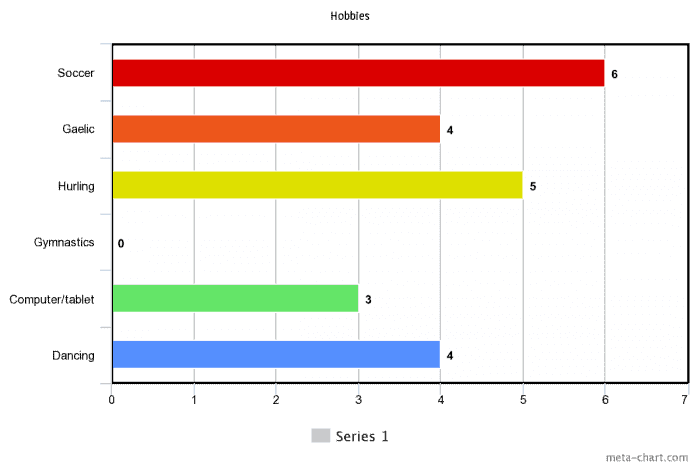
Fourth Class represented their survey using ‘meta-chart’ which allowed them to insert the information and a bar-chart/pie-chart would be produced for them. Third class represented their data using cubes and their individual whiteboards.


Fourth Class represented their survey using ‘meta-chart’ which allowed them to insert the information and a bar-chart/pie-chart would be produced for them. Third class represented their data using cubes and their individual whiteboards.